Welcome to the SO-CLOSE blog. We are La Tempesta, the project’s technical partners in charge of developing the three Digital Heritage Tools: interactive story map, immersive web-doc and participatory virtual exhibition.
We have decided to have a closer look at each one of the tools we’ve developed and today we will begin with the interactive story map.
Geography is fascinating! It helps us understand the spatial dimension of the human experience and how we relate with the physical and political world.
SO-CLOSE is a project that speaks about historical and present experiences of forced displacements. The time and the space of the displacements defines the individual and collective experience in a transformative way. The interviews conducted with refugees and stakeholders confirmed the great relevance of geography, not only on a political level, but also as a narrative thread of displacement stories.
The interactive story map is a storytelling tool based on maps.
Geography is the main narrative of the story map ant its digital journeys. These unfold through real world maps, combined with text, multimedia, immersive media and interactive features.
What can I do with the story map?
Create interactive map journeys combining text, multimedia and immersive photos and videos.
- Create journeys with geolocated stages
- Include one or two different itineraries in each journey
- Use real world geopolitical and physical maps
- Select and shuffle the 5 display modules
- Choose between several customisation options for the itineraries
- Accompany maps with text, images, videos and audios
- Compare photographs, side to side
- Integrate immersive 360 video and image players
- Juxtapose photographs in an interactive viewer
Publish and share stories as accessible, multilingual and web-based projects.
- Offer easy to reach accessibility settings: increase font, underline links, highlight links, increase contrast.
- Achieve a WCAG 2.1 AA level
- Display your project in different languages
- Publish on-line
Showcase
|
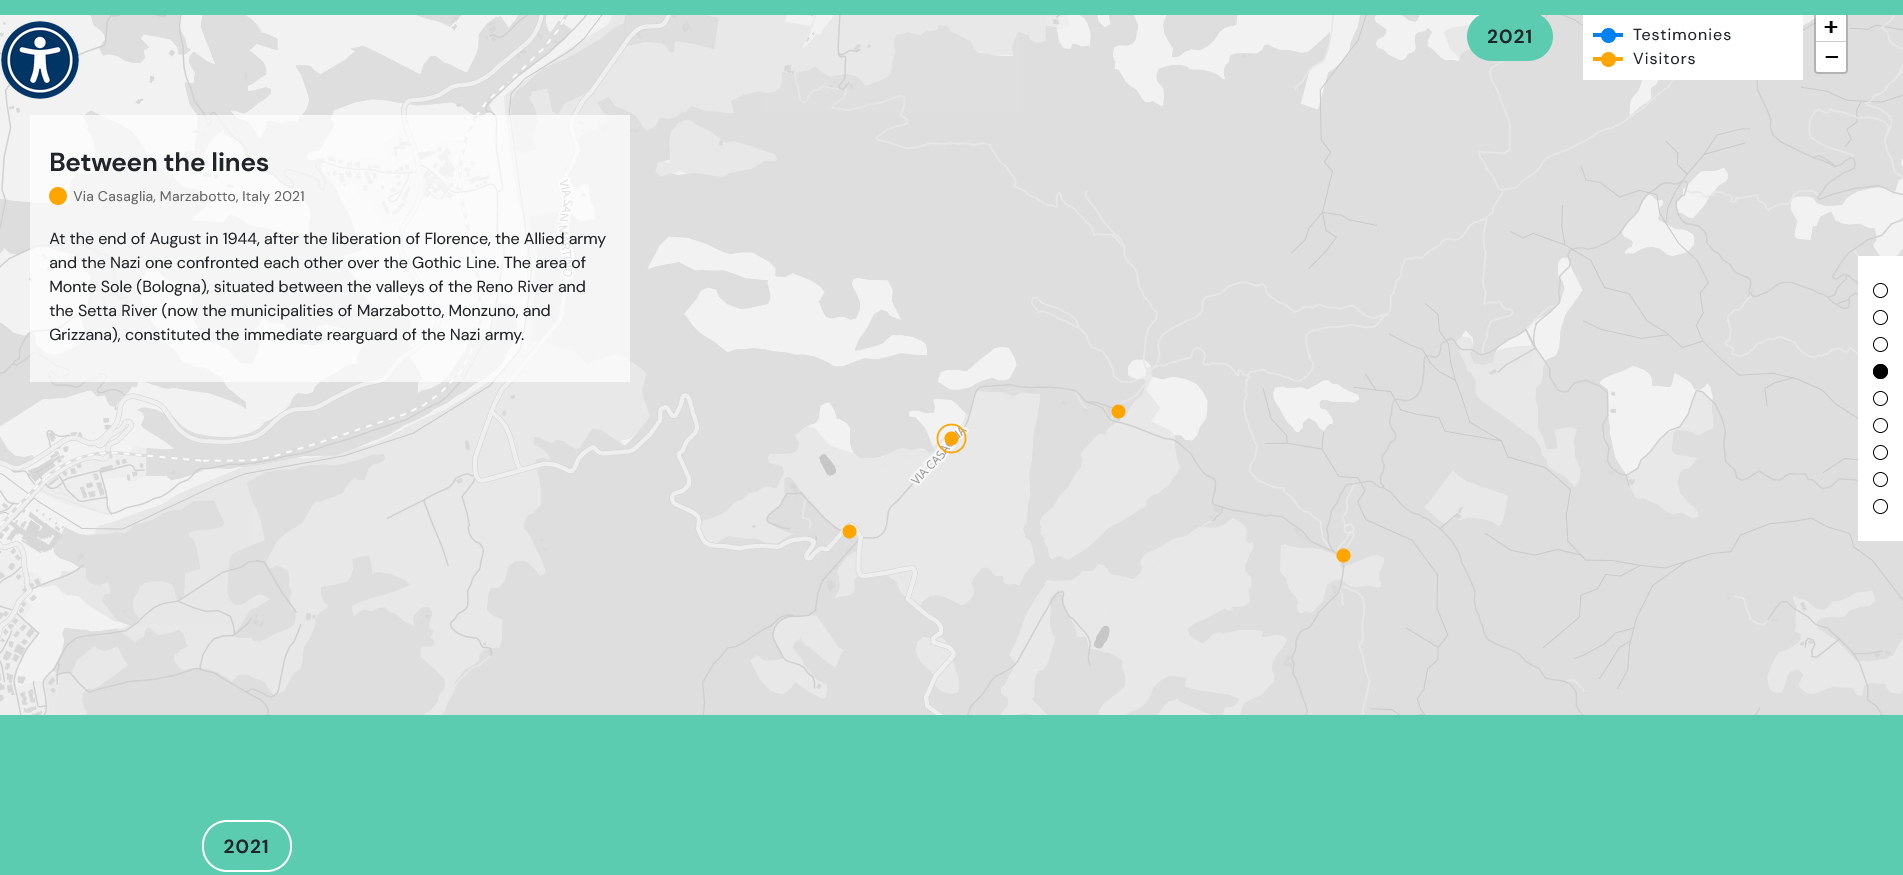
In the figure, we can see a part of a journey with two itineraries, Testimonies in blue and Visitors in orange. The four orange dots are the four stages of the Visitor’s itinerary and, in this case, we have used a module of a geopolitical background map, accompanied with text.
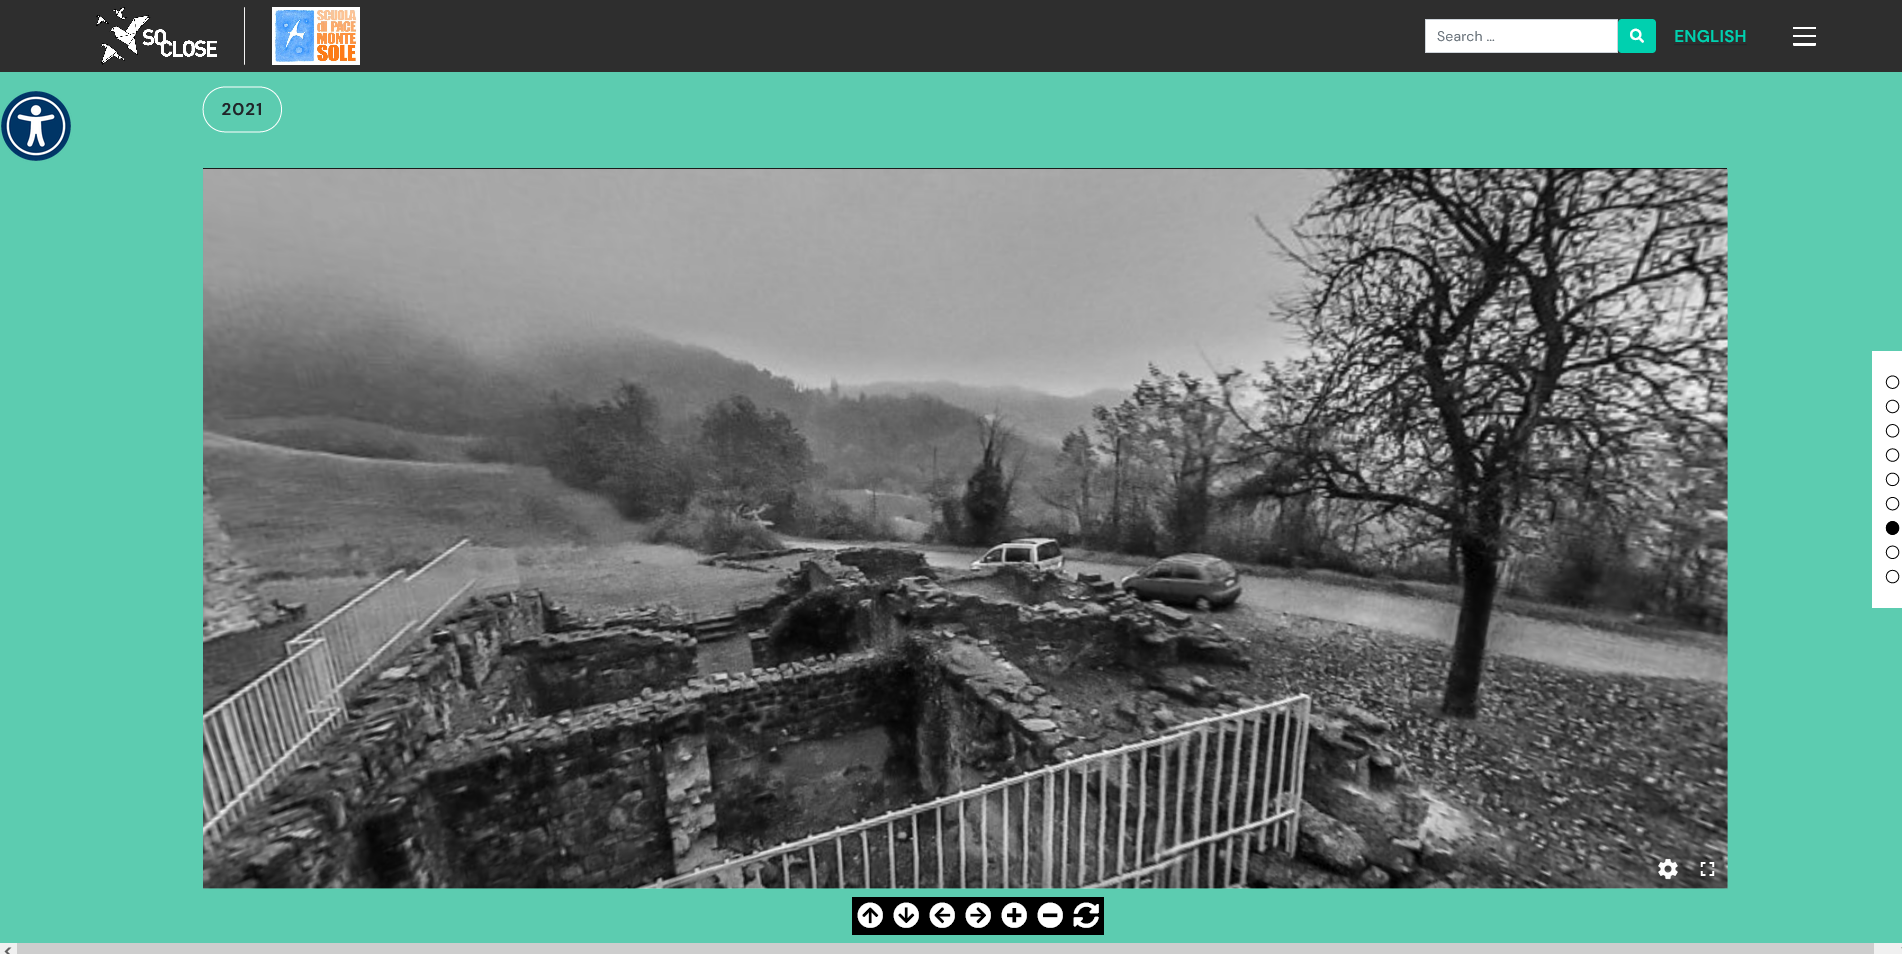
The tools also support immersive media visualisations: 360o images and videos. The following figures is an example of an interactive 360 image module.
Stay tuned for the immersive web-doc and participatory exhibition presentation, to come in the following months.